4 min read


It’s All In the Risk: Consistency of Return
We wouldn’t go so far as saying we’ve always had a contrarian view, but we do have an established history of always looking outside the mainstream to find an edge for our clients.
As we’ve been watching the market over the last ten years, what has been interesting to us is that investors seem to be almost in a barbell shape – either piling into passive funds, or making big bets on individual high-growth stocks. As this happened, the market became very concentrated. And portfolio diversification founded on non-correlated assets was left behind.
We believe that the best way to preserve and grow capital is consistency of returns. That’s why we’ve created a quantitative portfolio solution that looks not at the so-called predictive potential of historical return streams – we look at historical risk. Because statistically, past risk tends to be a better predictor of future risk. And tools that can estimate risk have the potential to create consistent returns, by identifying non-correlated assets.
Rules-Based-Investing
Rules-based-investing is a process, not a strategy. It refers to the impartial screening and rebalancing of portfolio assets or positions. The goal is to eliminate emotion, bias and subjectivity from the investment decision-making process.
Gut feelings and instincts may be a vital part of human psychology and physiology that helps us survive – but they’re not great investing tools. Emotion and psychology cause us to behave in unpredictable or irrational ways – and these lead to irrational decisions that drive poor outcomes. The more subjectivity that can be removed from the process, the better the outcome will be. Rules based strategies are designed to remedy this negative investing behavior.
Attempting to time the market is a good example of this type of emotional investing behavior. Let’s take a look at some data.
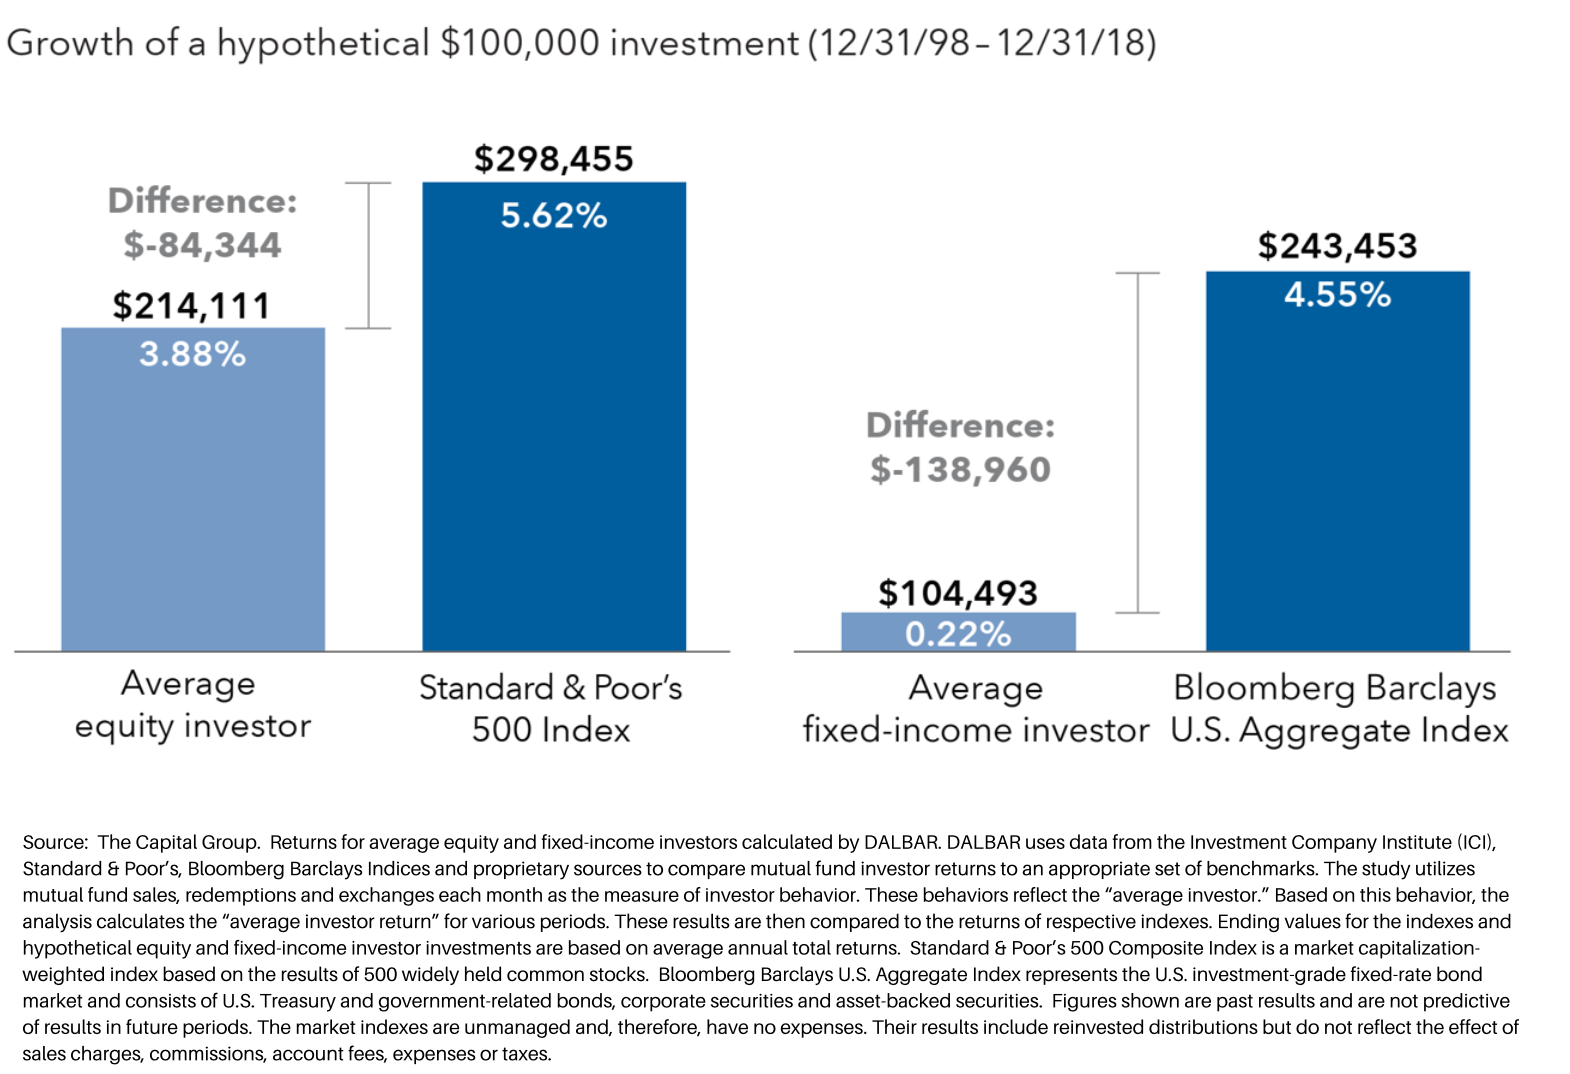
Below is a recent study by DALBAR, a financial research firm. They used mutual fund flows to create an “average investor profile” that they compared to the index returns for equity and fixed income. The data speaks for itself – in both cases the average investor significantly underperformed.
What Are the Rules?
Well, depending on the asset class or the portfolio objective, to get to a representative result there can be a lot of them. But there are four overarching principles:
- Completely data-driven
- Mitigate subjectivity or biases in decision making
- Avoid performance chasing behavior
- Impose a defined sell discipline
The rules drive to a specific objective. They allow the model to identify behavior, relationships, and the correlation between assets/market instruments. To ensure that there is no data mining and that the software doesn’t “form fit” returns to forward looking data (because it knows how the asset performed over time), we only allow for out-of-sample testing of the model’s performance.
How Are They Deployed?
The methodology for implementing the rules across a given data set is simple:
- Analyze volatility of individual funds or securities
- Analyze correlations across funds or securities
- Constrain asset class, sector and fund/security level weights
We developed the process because we believe that optimizing portfolios based on estimating risk rather than estimating forward-looking asset returns will potentially result in a more consistent financial outcome or experience. Past asset risk behavior tends to be a more consistent predictor of future risk than past returns are of future returns. And if you have a handle on risk – you can effectively increase diversification, which correlates to consistency of return.
Interested in a portfolio designed to potentially stand the test of time?

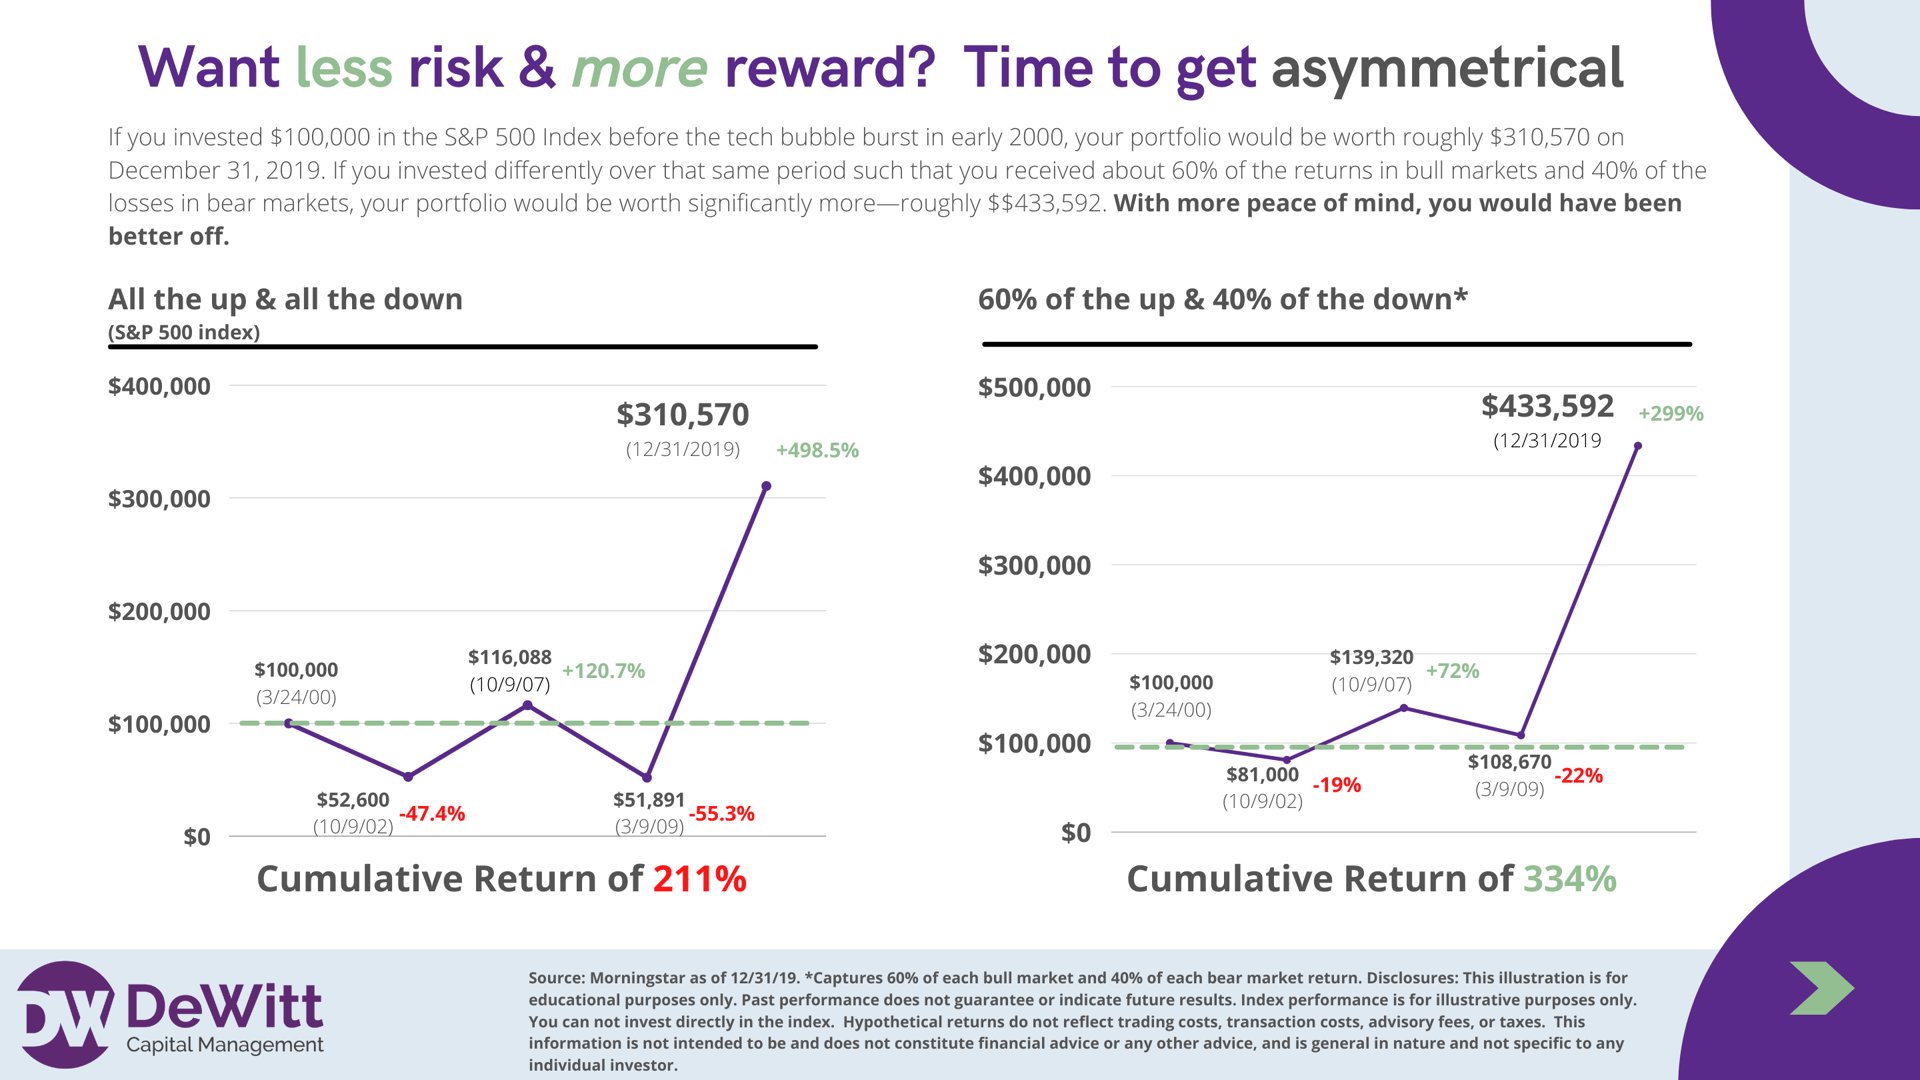
Smooth the Ride to Support Financial Outcome Consistency
The importance of managing volatility dramatically increases for investors near or in retirement as taking distributions when your portfolio is down can result in permanent losses which may take multiple years to recover. If you could build a portfolio framework such that you could participate in 60% of the gain in bull markets and 40% of the losses in bear markets, a portfolio of $100,000 would be worth $433,592 vs $310,570 for the S&P 500 Index from just before the dot-bubble collapse to the end of 2019. This is what is known as portfolio asymmetry. This hypothetical portfolio captured a superior return with less volatility and drawdowns.*
The Bottom Line
Preserving and growing wealth is the goal of effective asset management. We believe that by combining technology, a dynamic adaptation to market cycles, and a rules-based approach, we can create portfolios with lower correlations, lower volatility and more consistent returns.
Interested in a portfolio designed to potentially stand the test of time?
We Deliver Content Like This Every Month to Your Inbox. Sign Up to Start Receiving Updates
Related Posts
Of Course I’m Diversified, I'm Benchmarked to the S&P 500!
We hear sentiments like the title of our piece a lot. It’s a reasonable assumption, right? After...
Traditional Financial Planning – With A Non-Traditional Edge
Traditional Financial Planning – With A Non-Traditional Edge
For decades, DeWitt Capital has always...
It's Never too Early to Start Work with an Advisor
Whether you’re just beginning your investing journey or have been on it for many years, chances are...